28 May 2011
This post is part of a series describing the August 23, 1966 project.
In researching ways to detect the human heartbeat, we found that photoplethysmography would be the simplest and least expensive way to bring an immediate and personal touch to the gallery installation. A photoplethysmograph is usually obtained with a pulse oximeter - this is the device used in hospitals that grips a person’s finger to measure their heart & respiration rates.
A pulse oximeter simply illuminates the skin with light from an LED (usually infrared), and measures the luminance of the skin on the other side. Each cardiac cycle brings more blood to the extremities, the finger becomes denser, and thus less light passes through to the detector. When the blood flows away, more light is let through. This fluctuation can be measured and the timing of the luminance peaks used for determining the heart rate.
This project required knowledge of signal processing filters and operational amplifiers. This schematic describes the circut used inside the pulse oximeter. It is also provided as a Fritzing file.
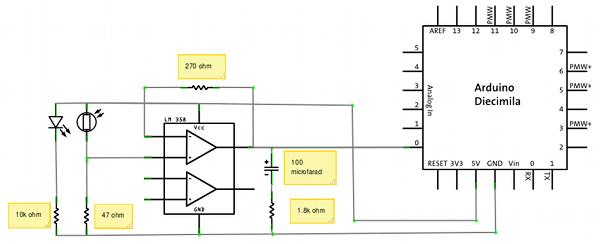
For fun, you can look at the original schematic.
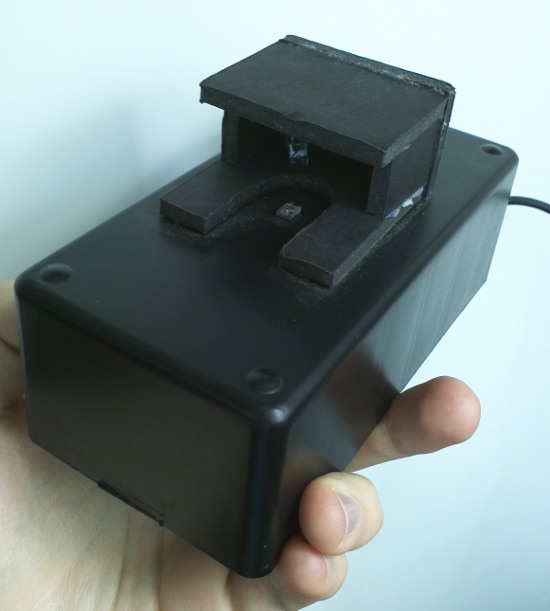
This device is advantageous for its low intrusiveness. In our implementation, the visitor just needs to gently place their finger on top of the light sensor. Depending on the person, the shape, rate and range of the photoplethysmograph obtained can vary widely, but we found the results distinct enough to obtain a stable heart rate from most visitors in under 15 seconds.
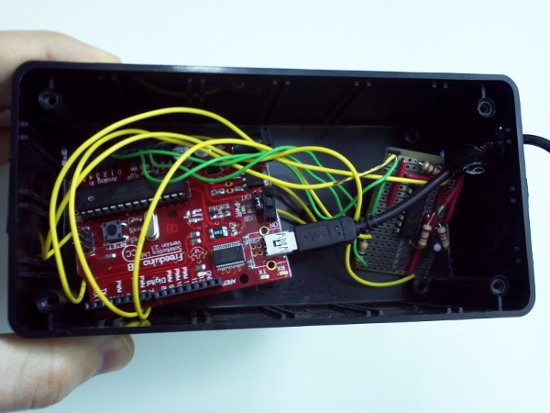
Our device used the amplified signal of an inexpensive photo-resistor passed through a high pass filter and captured by an Arduino microcontroller. The microcontroller fed an averaged luminosity to a Processing sketch on the host computer, which analyzed the signal for peaks. The peaks were then converted to a frequency, and passed along to the gallery software. The software is general to heart rate monitoring, and can be used for other applications that are interested in the data. There is also a sketch to visualize the value of the pulse oximeter on a graph.
Continue to the next section, details of the audio recordings of August.


